Urban Data Layers for Planners & Consultants In Minutes
Fast, accurate insights you can use in proposals, feasibility studies, and client projects.


Trusted by urban planners
"In some cities, gathering the data can take a couple of days. Maporra really reduces that effort."

Policy advisor, Urban planner, Researcher • Milan, Italy
Urban planner and policy advisor with nine years' experience in public, academic, and nonprofit sectors. Focused on sustainable development, just cities, social inclusion, and innovation.
Insights in Action
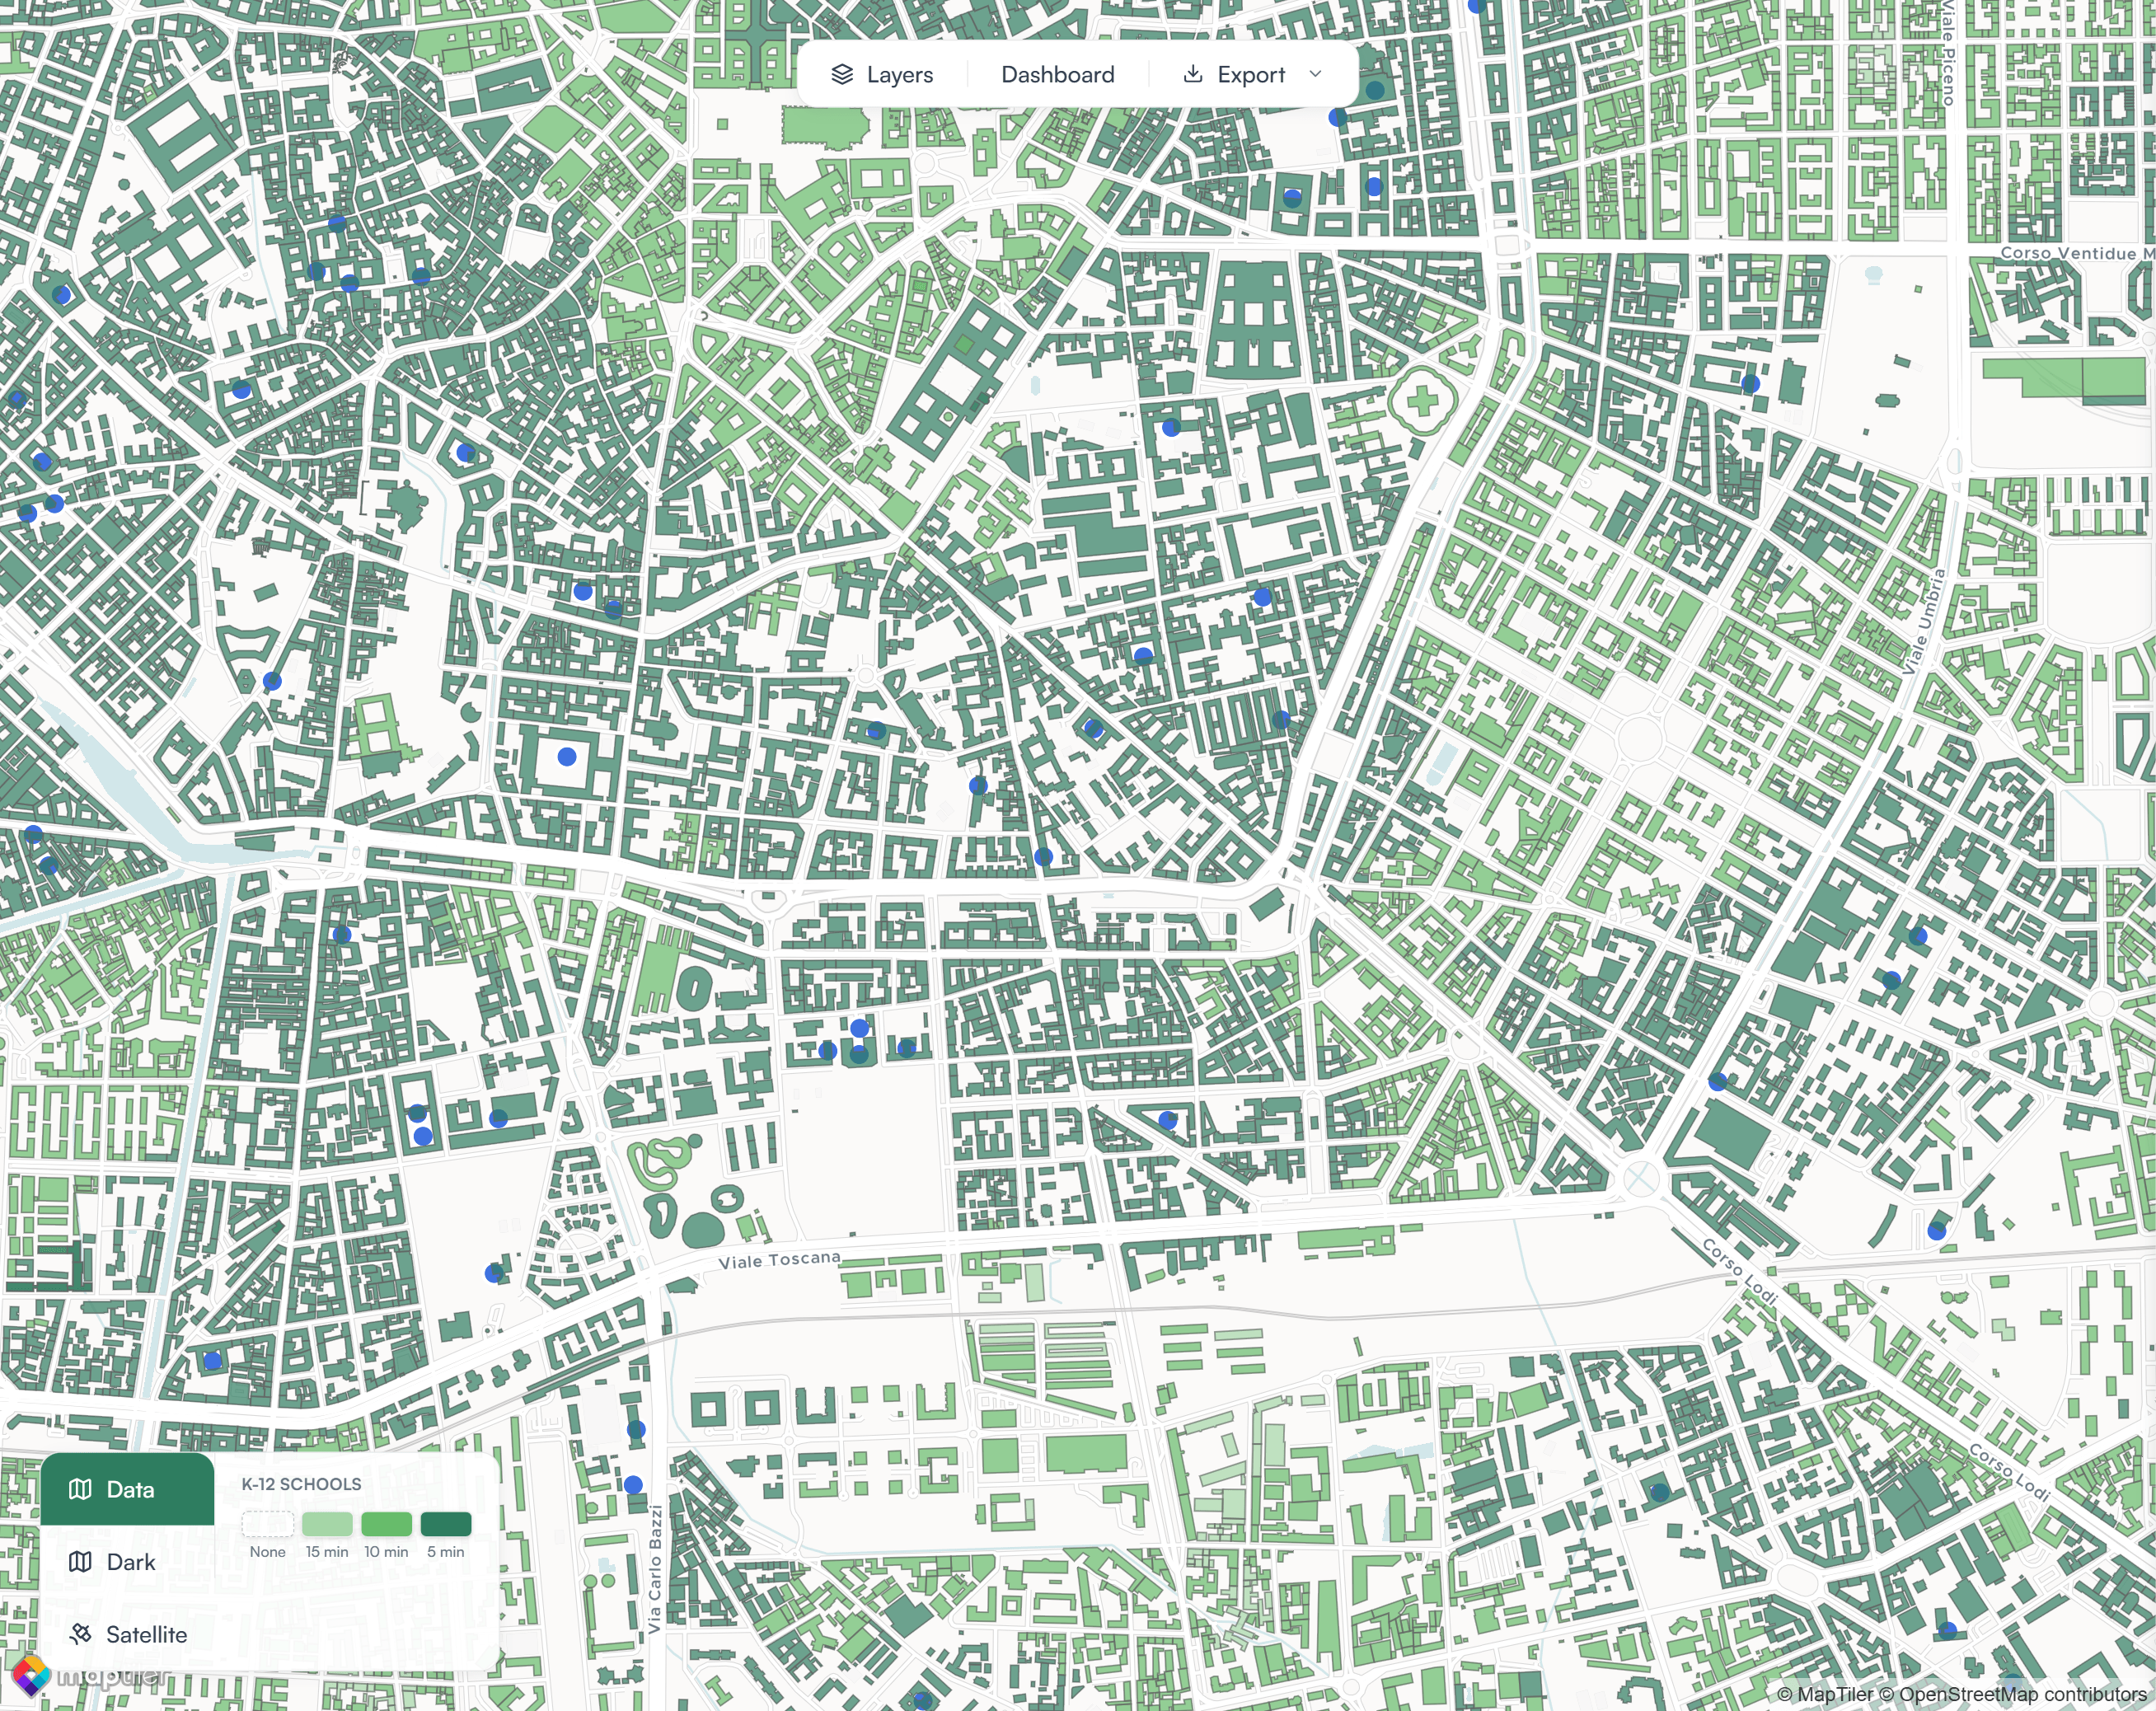
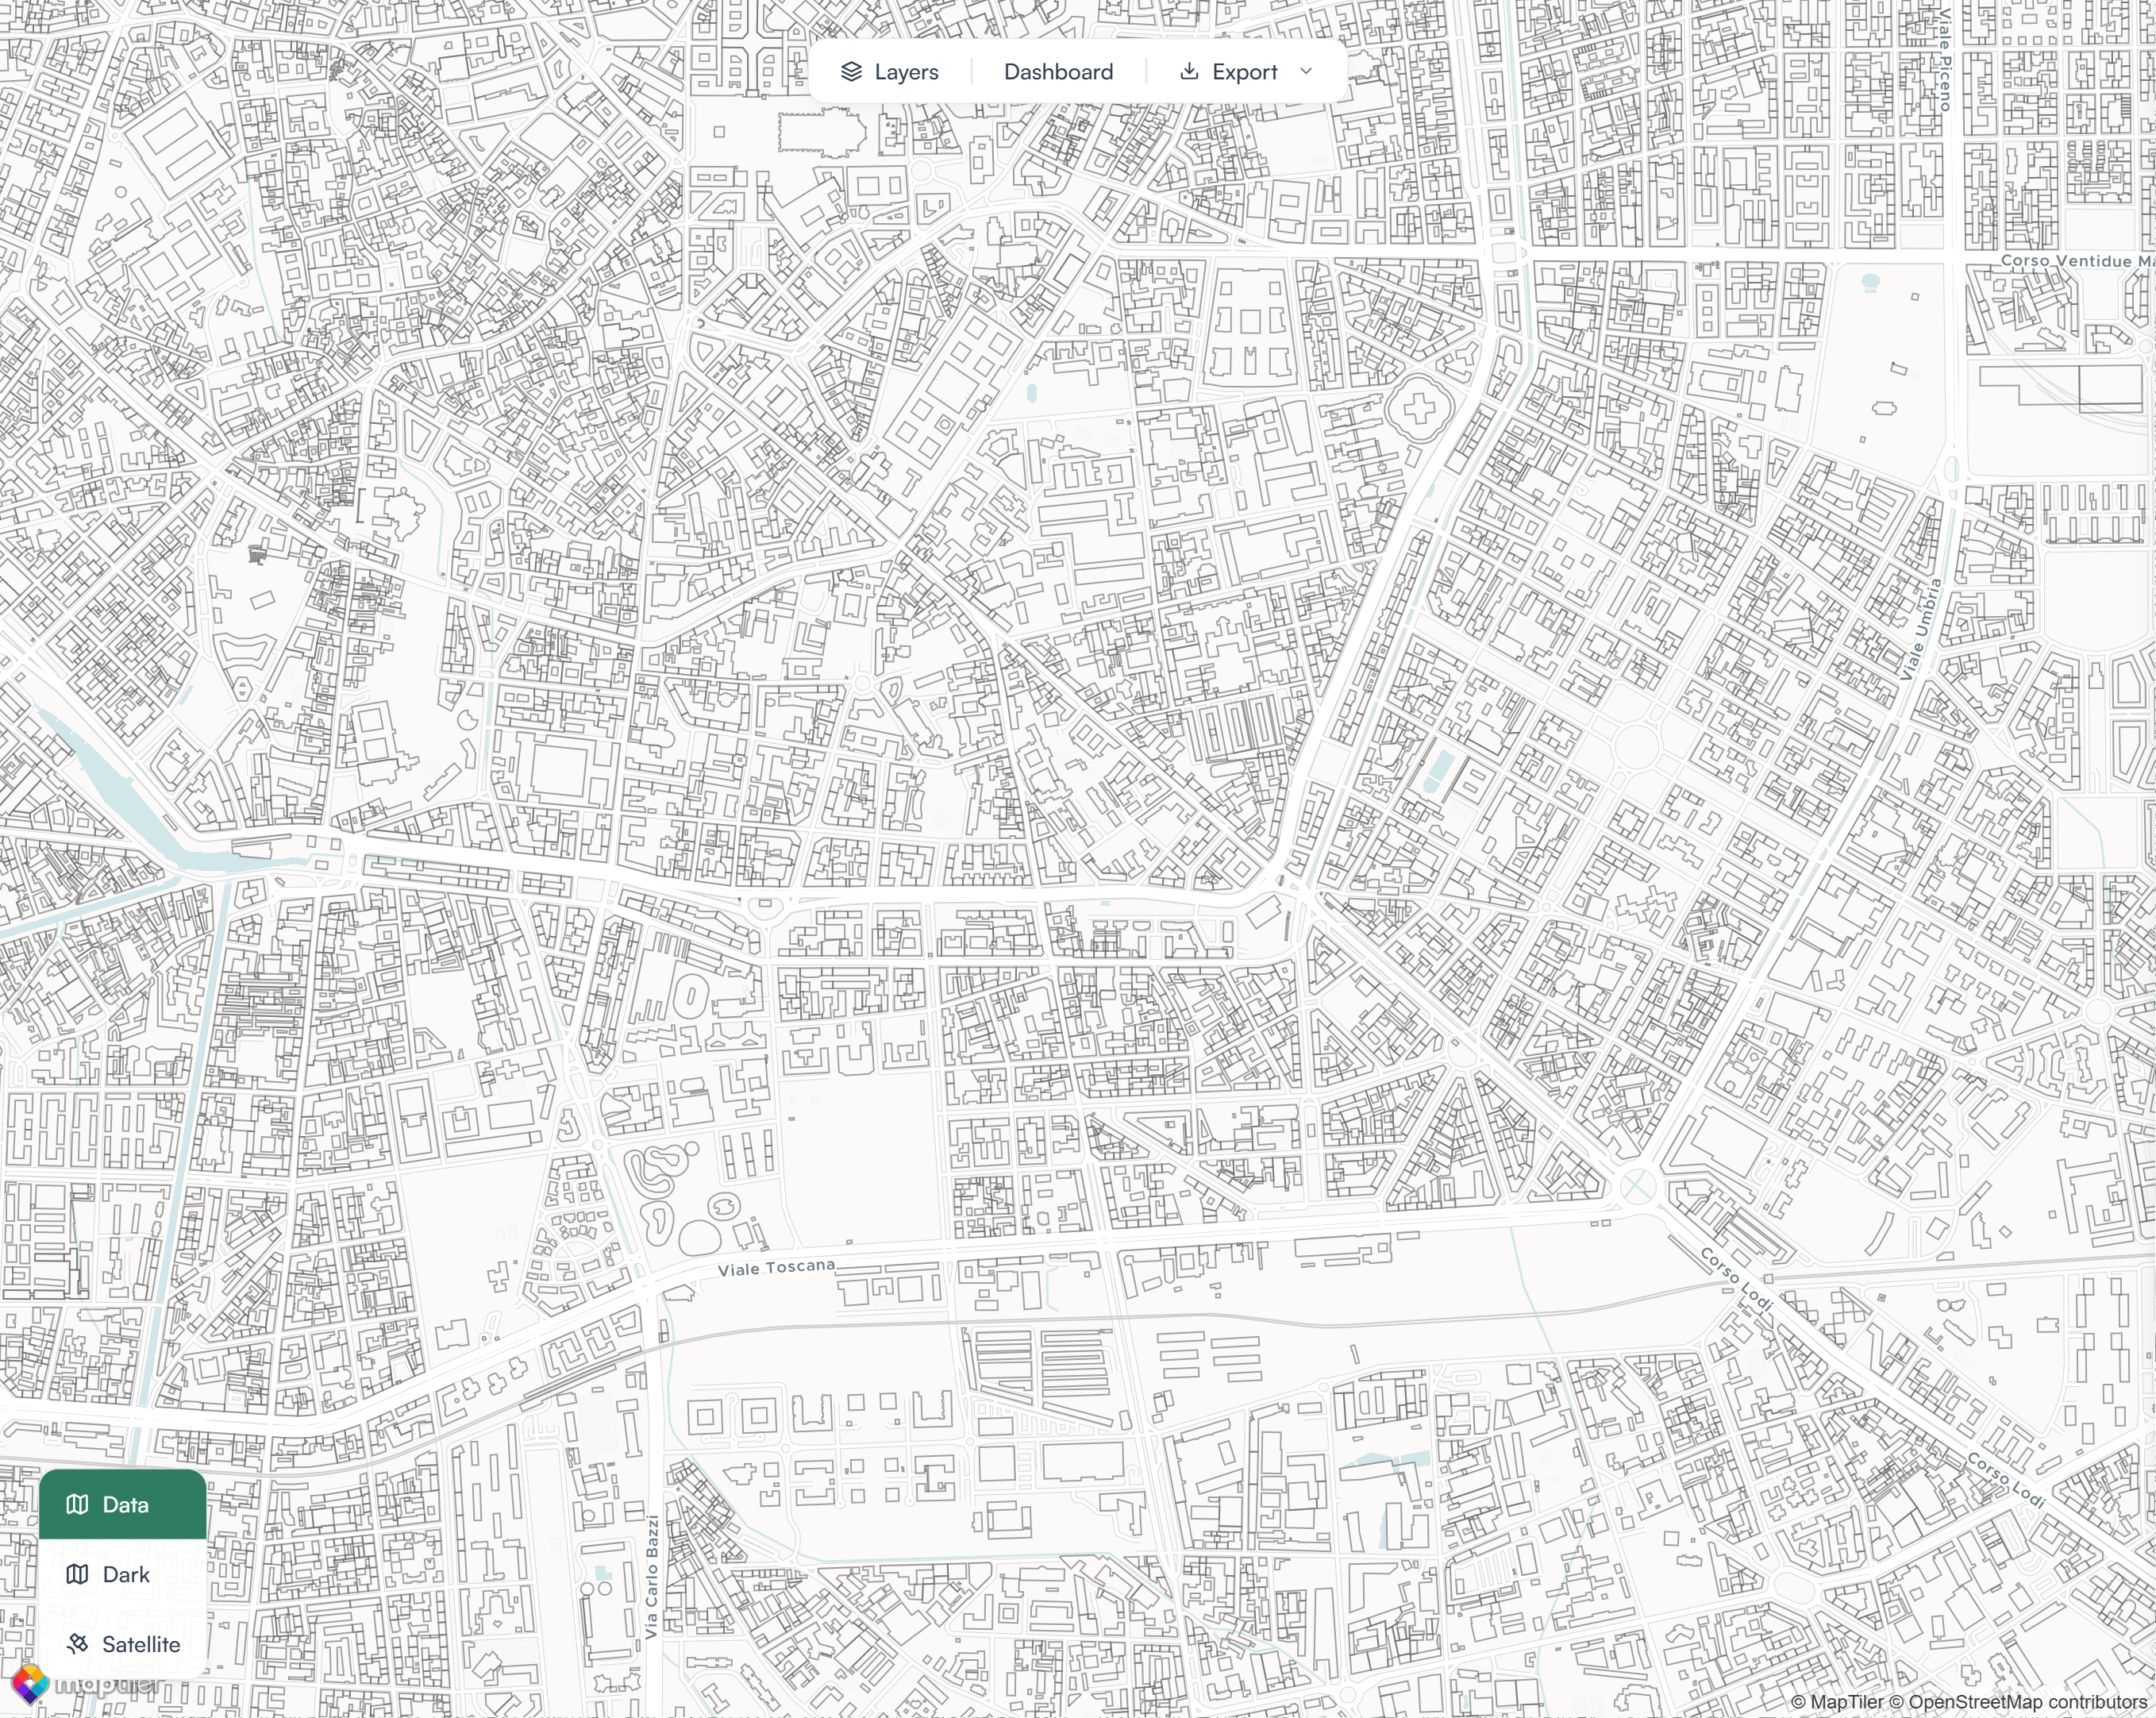
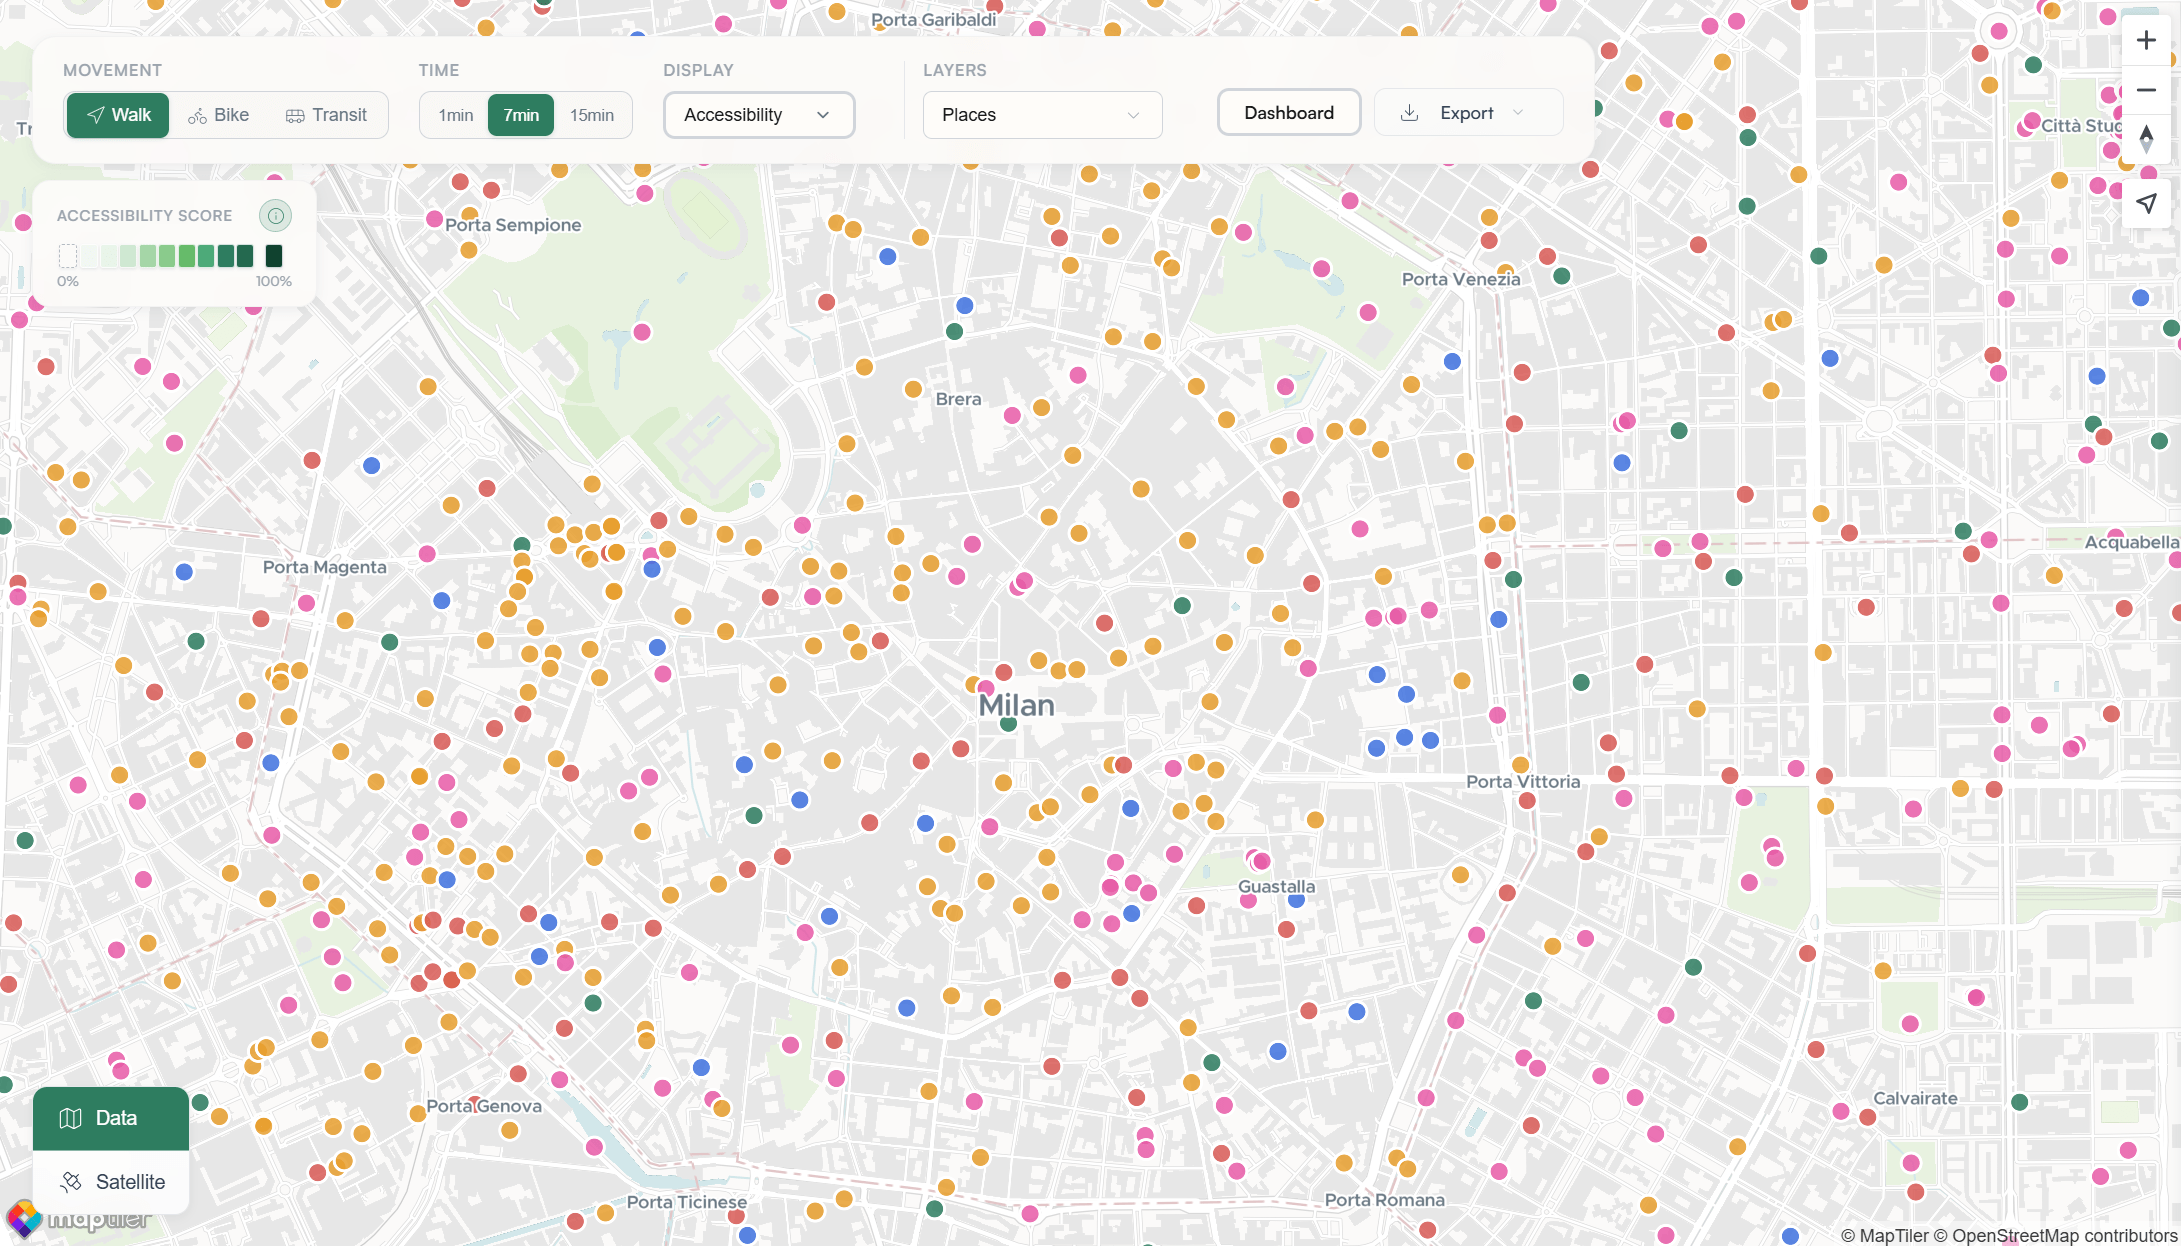
Accessibility Insights
Quickly analyze walking access around your project areas. Perfect for feasibility studies, proposals, and early-stage planning work. Never wonder:
Which neighborhoods are most accessible?
How accessible is an area for walking?
What places can a building reach within a 5, 10, or 15 minute walk?
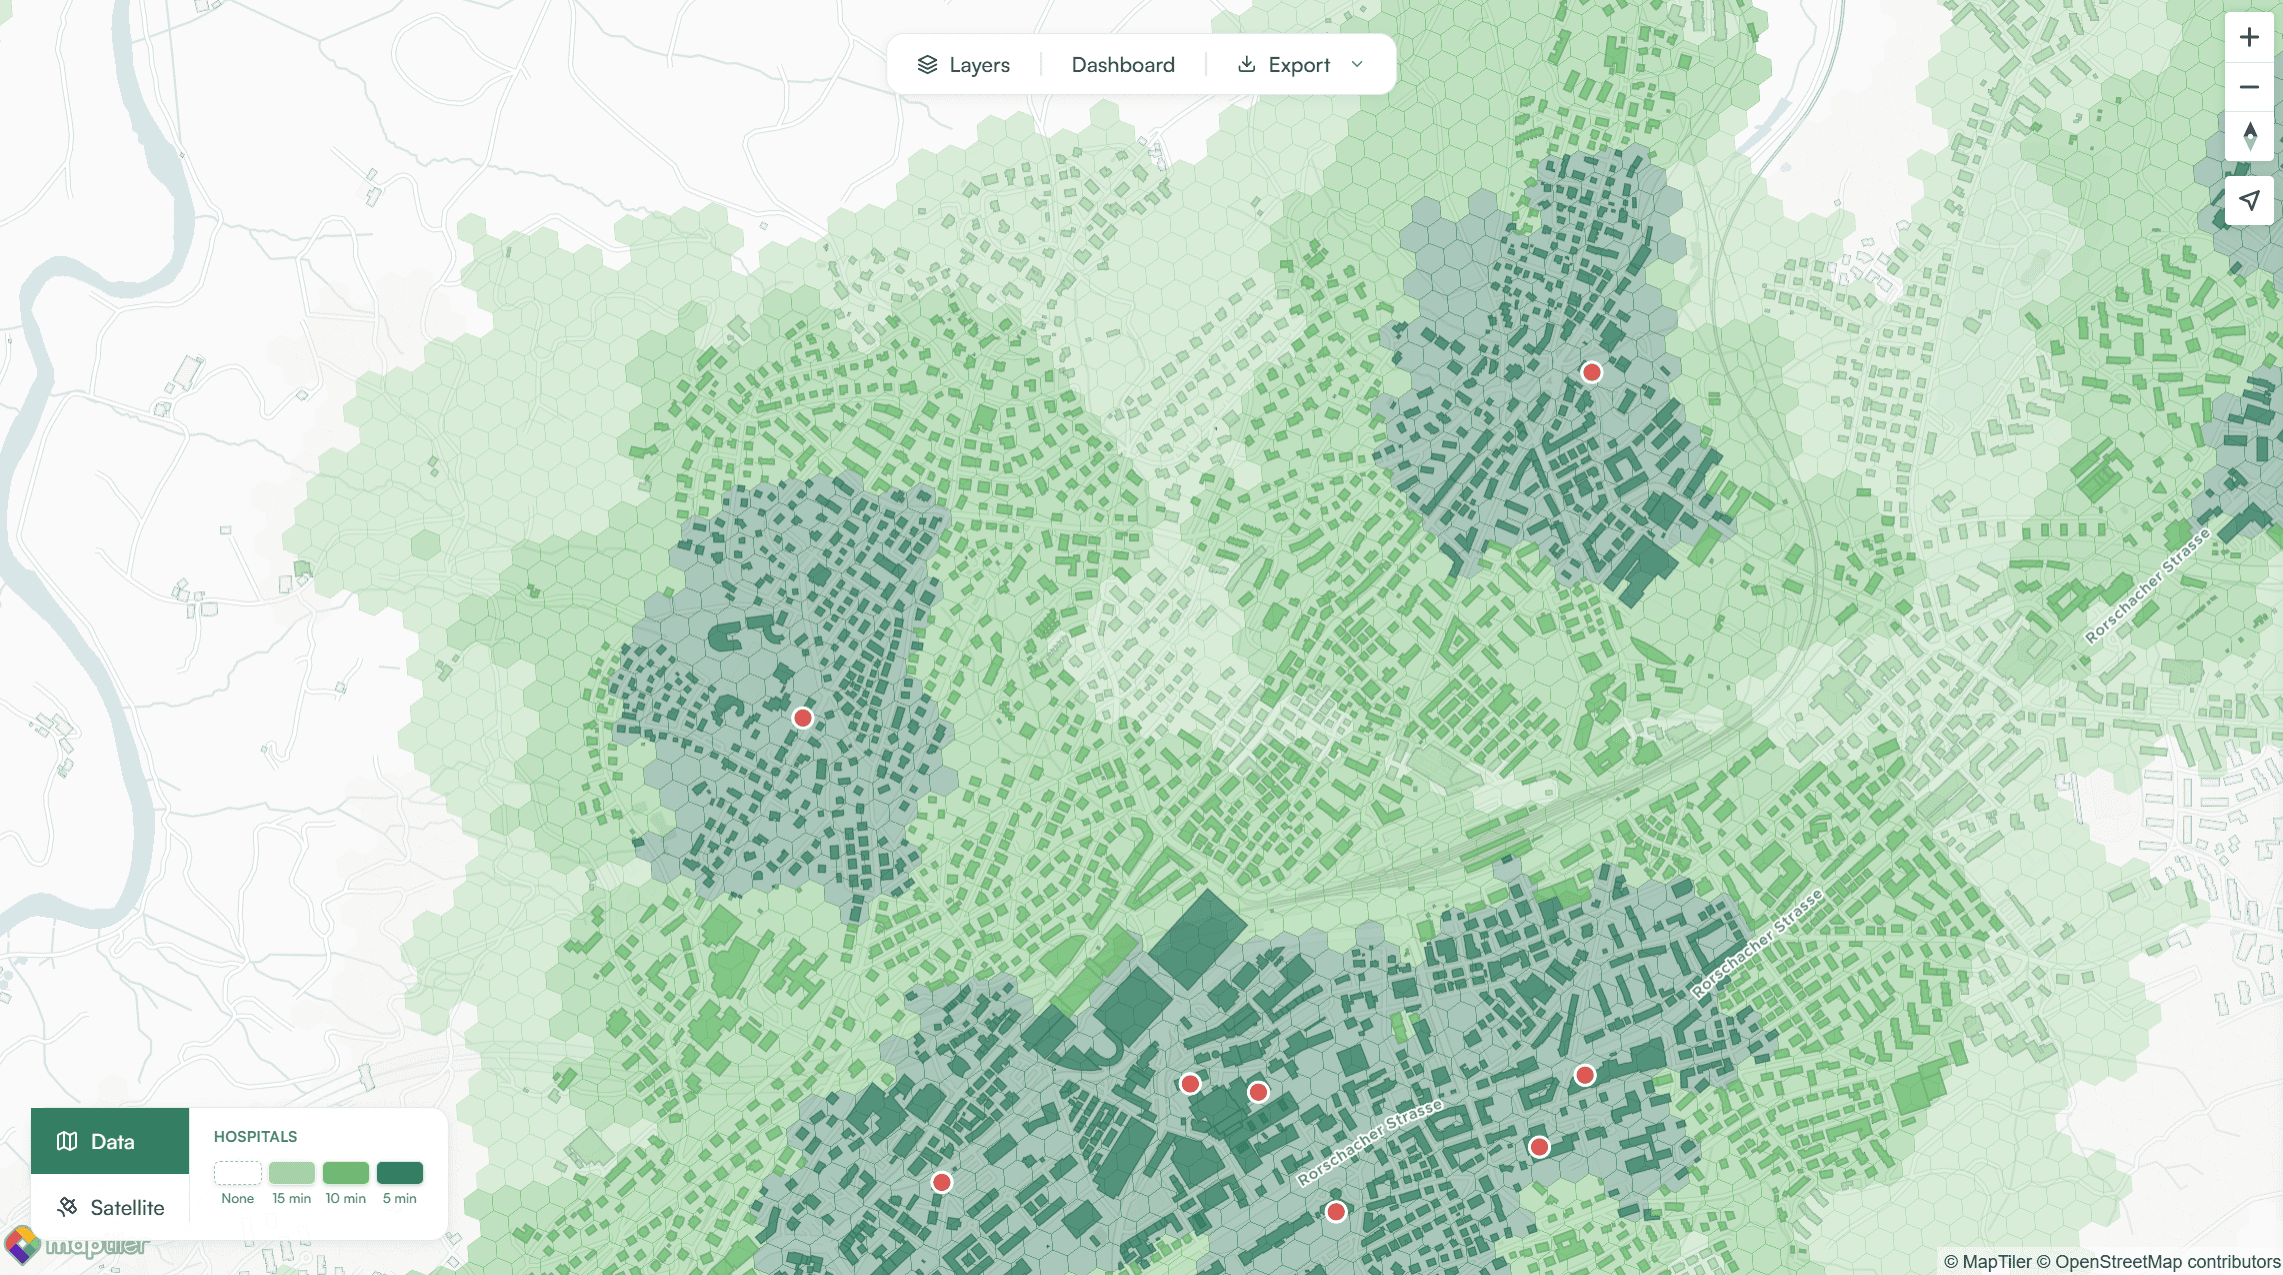
Walk Accessibility
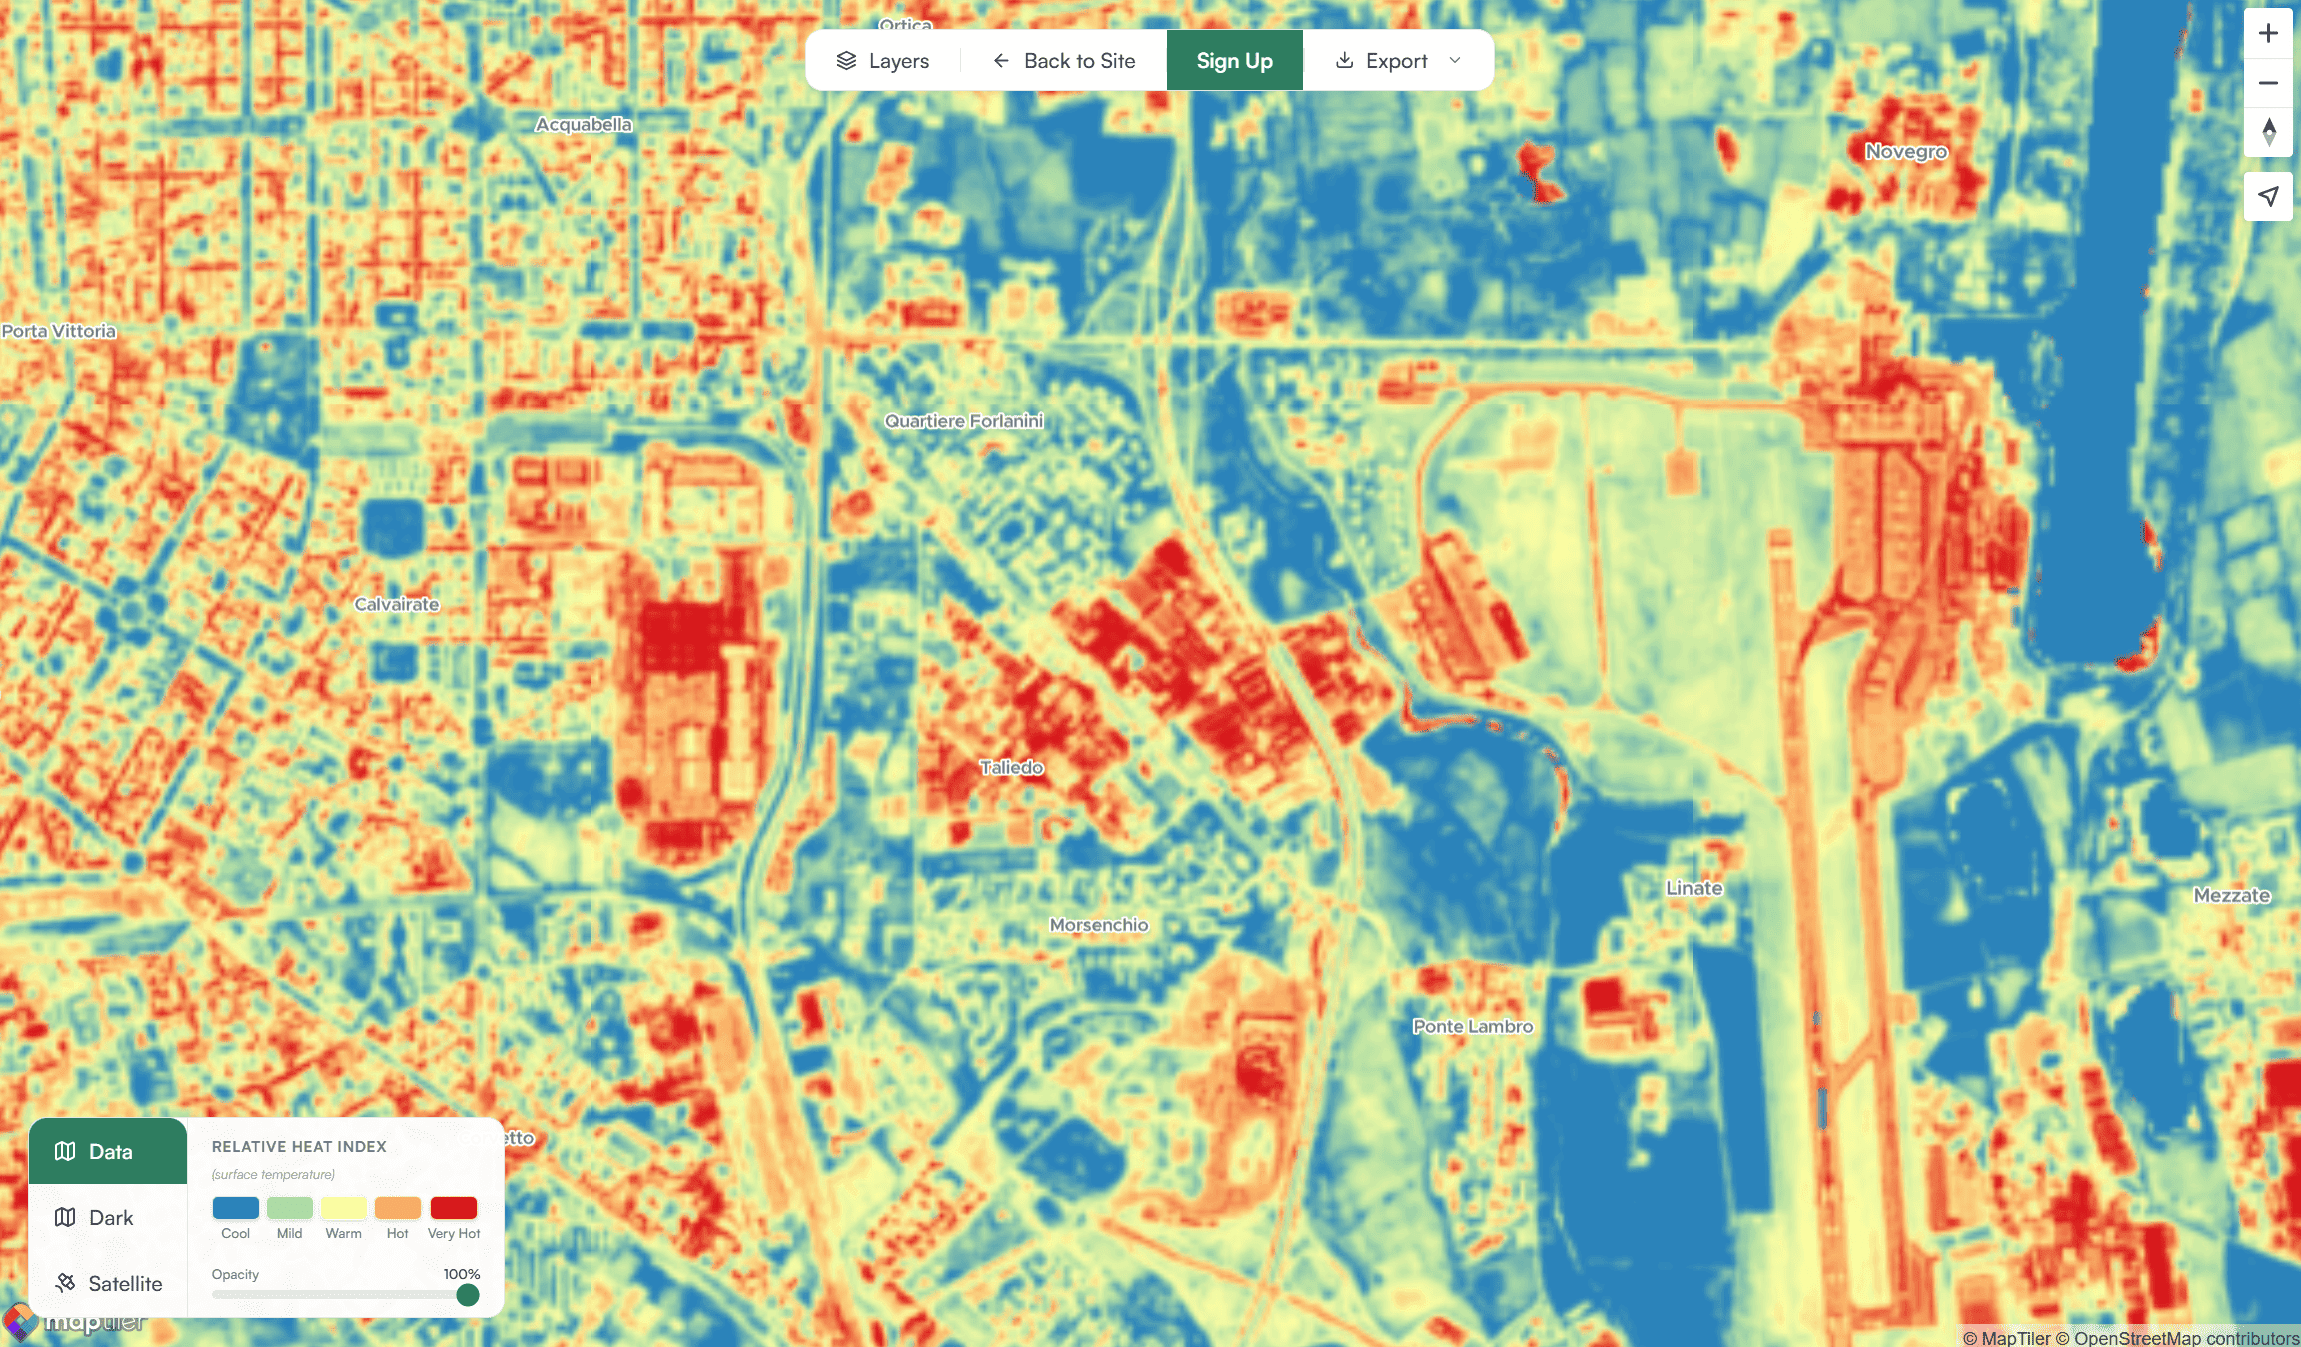
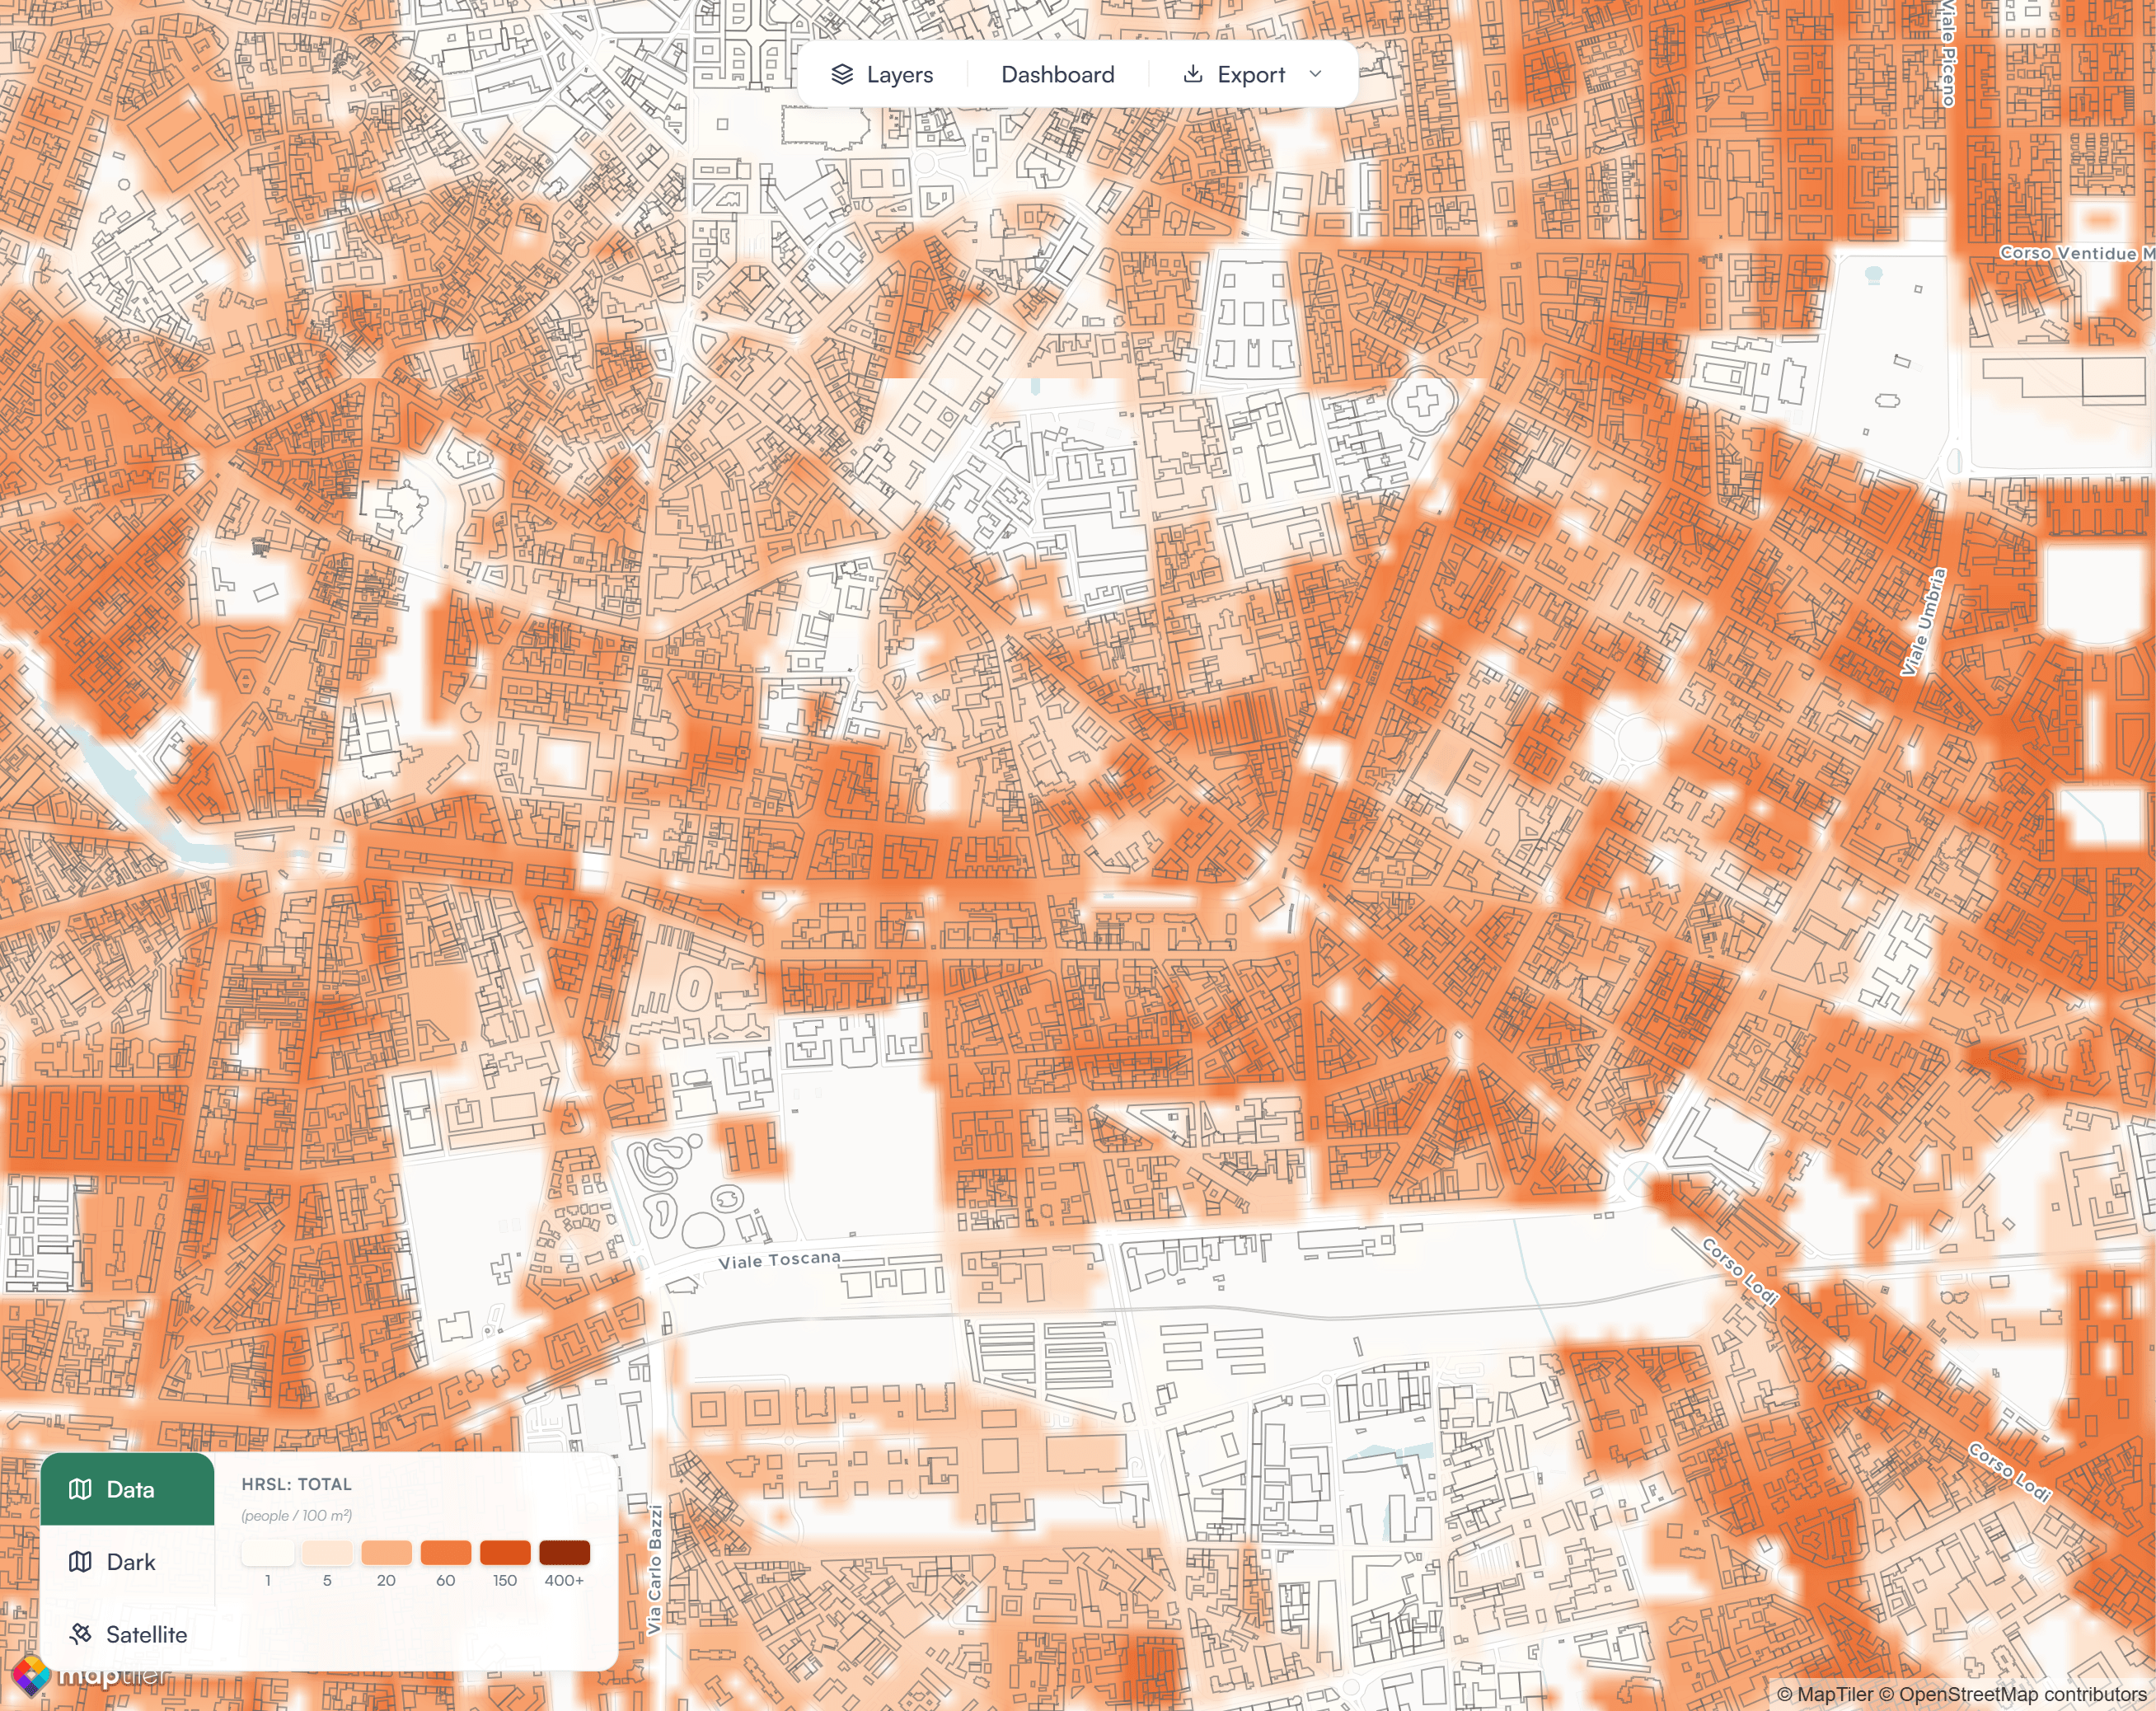
Surface Temperature
Surface Temperature Analysis
Identify urban heat islands instantly. Use surface temperature layers to support climate analyses and communicate impacts clearly to clients. You can quickly answer:
Where are the hottest and coolest areas in the city?
How does temperature vary between neighborhoods, streets, and blocks?
Which locations experience heat stress or urban heat island effects?
Population Analysis
Understand population distribution at a glance. Great for market studies, mobility planning, and identifying priority areas for interventions. You can quickly answer:
How many people live within a specific block, neighborhood, or district?
Which areas are underserved or overburdened based on population patterns?
What are the age demographics of a given area (children, working-age, seniors)?
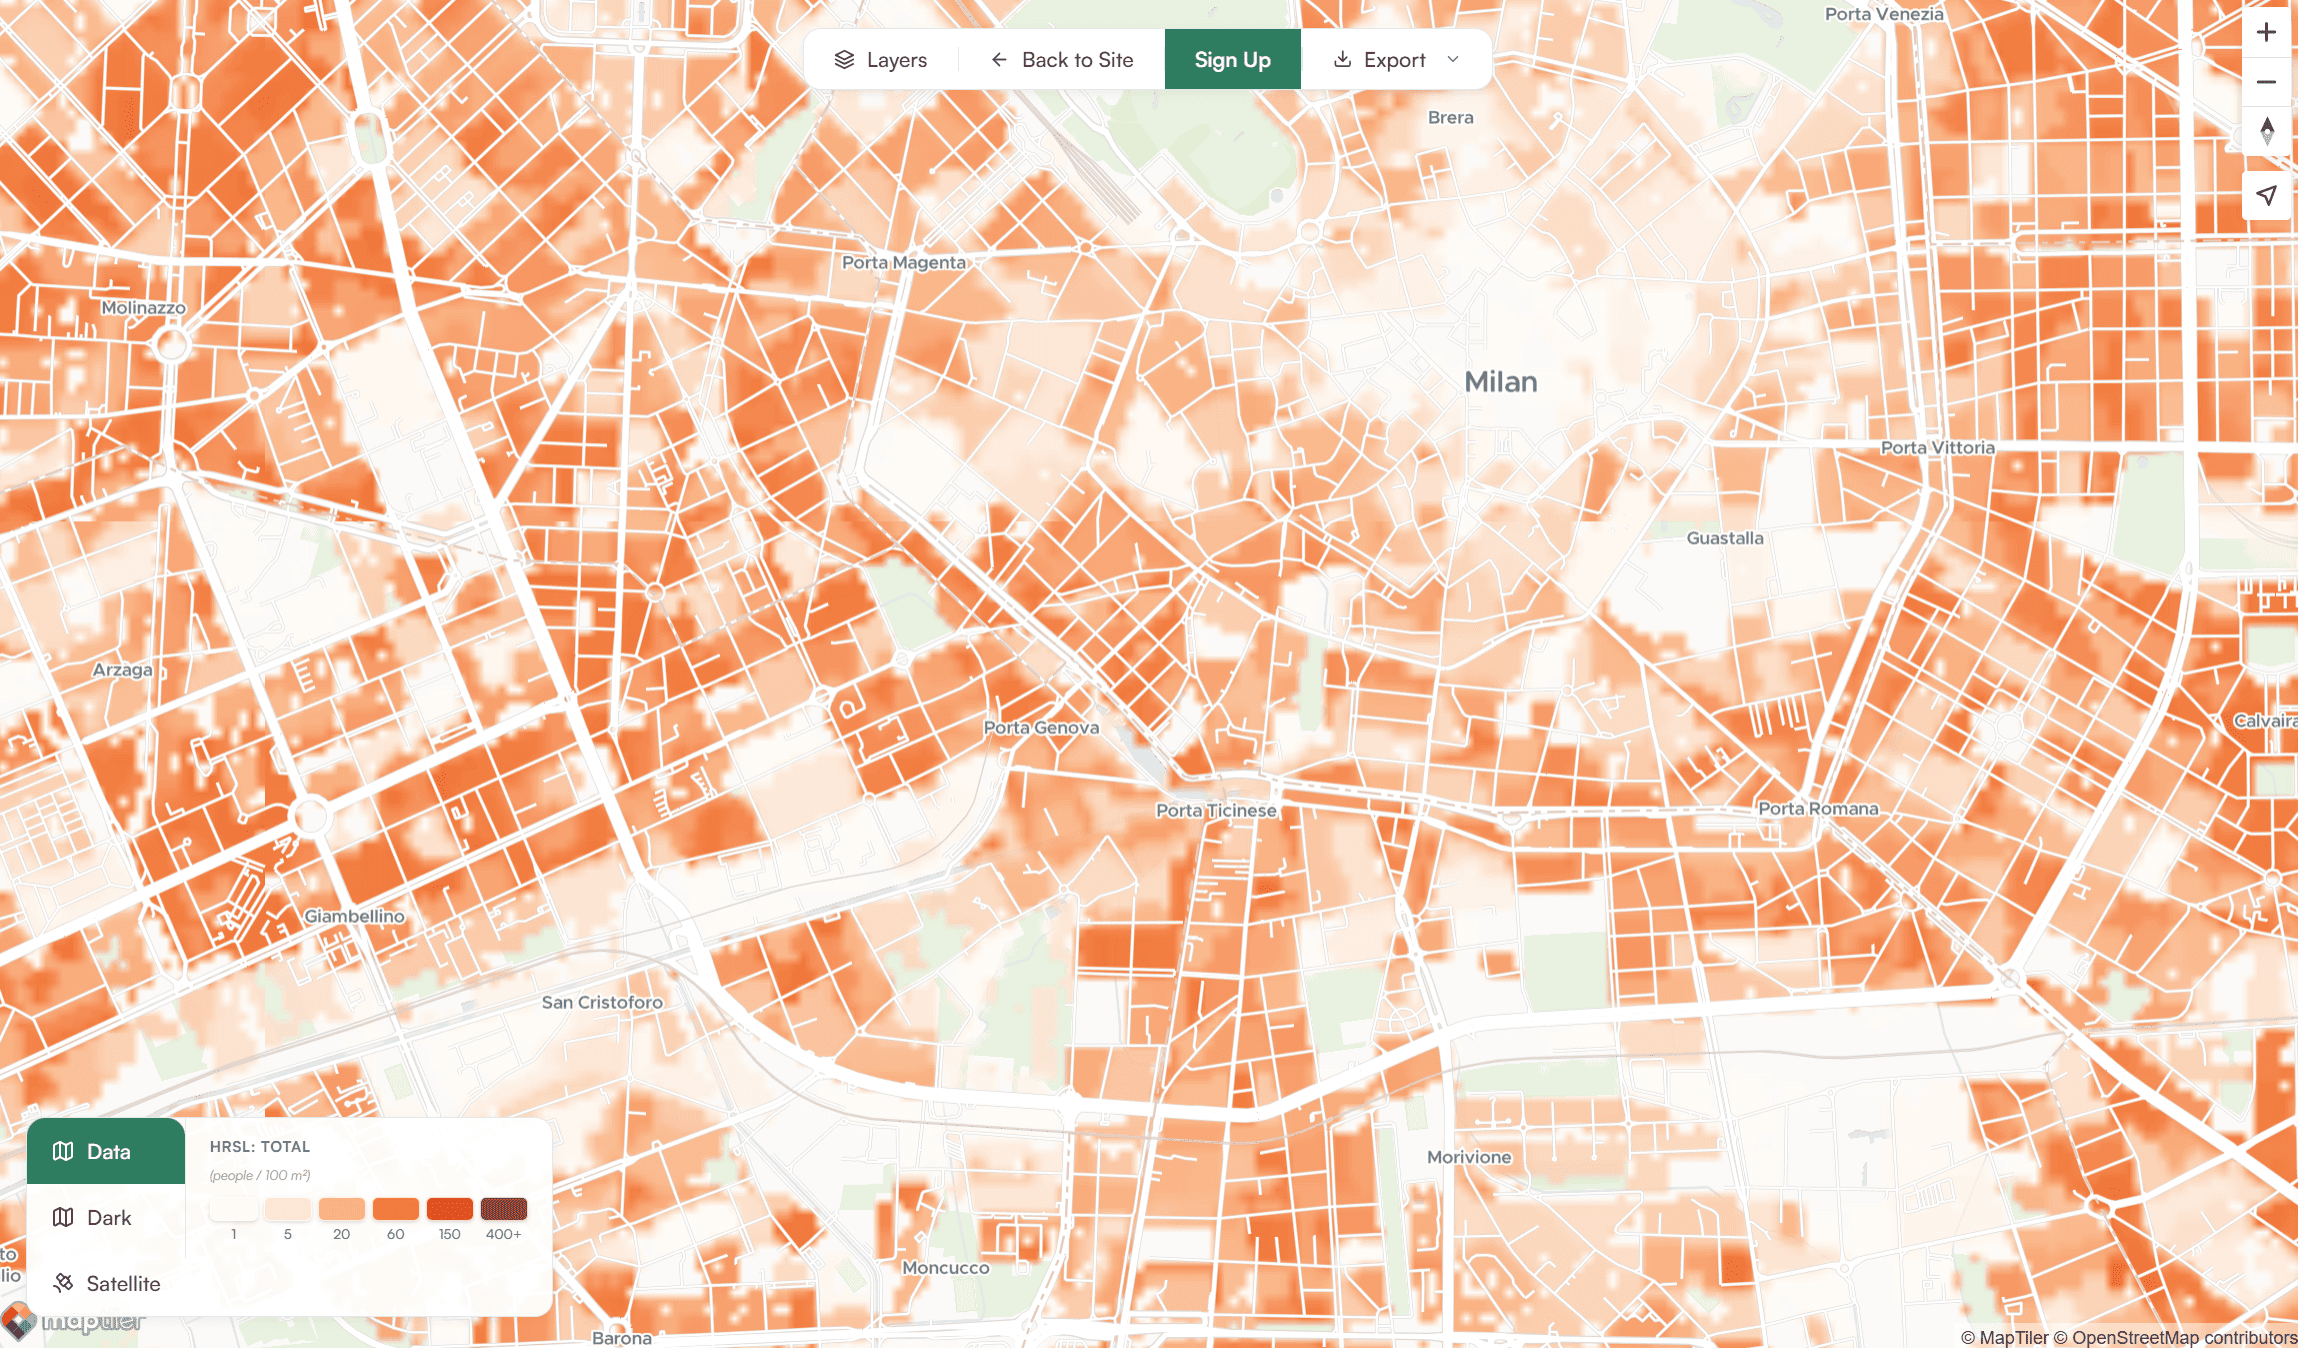
Population
Export Options
Quick Sharing & Reporting
Quickly share results with your team, community, or clients in PDF, GeoTIFF, and GeoJSON formats.
How it works
- STEP 1Choose your region
Choose your region and let Maporra build the analysis.
- STEP 2Visualize & analyze
Explore all data layers and analyze the results.
- STEP 3Export & share
Quickly export GeoJSON, GeoTIFF, and PDF maps.
Official and Institutional Data Sources
Maporra blends satellite imagery, population grids, global maps, and official transport data into a single, consistent view of your city.
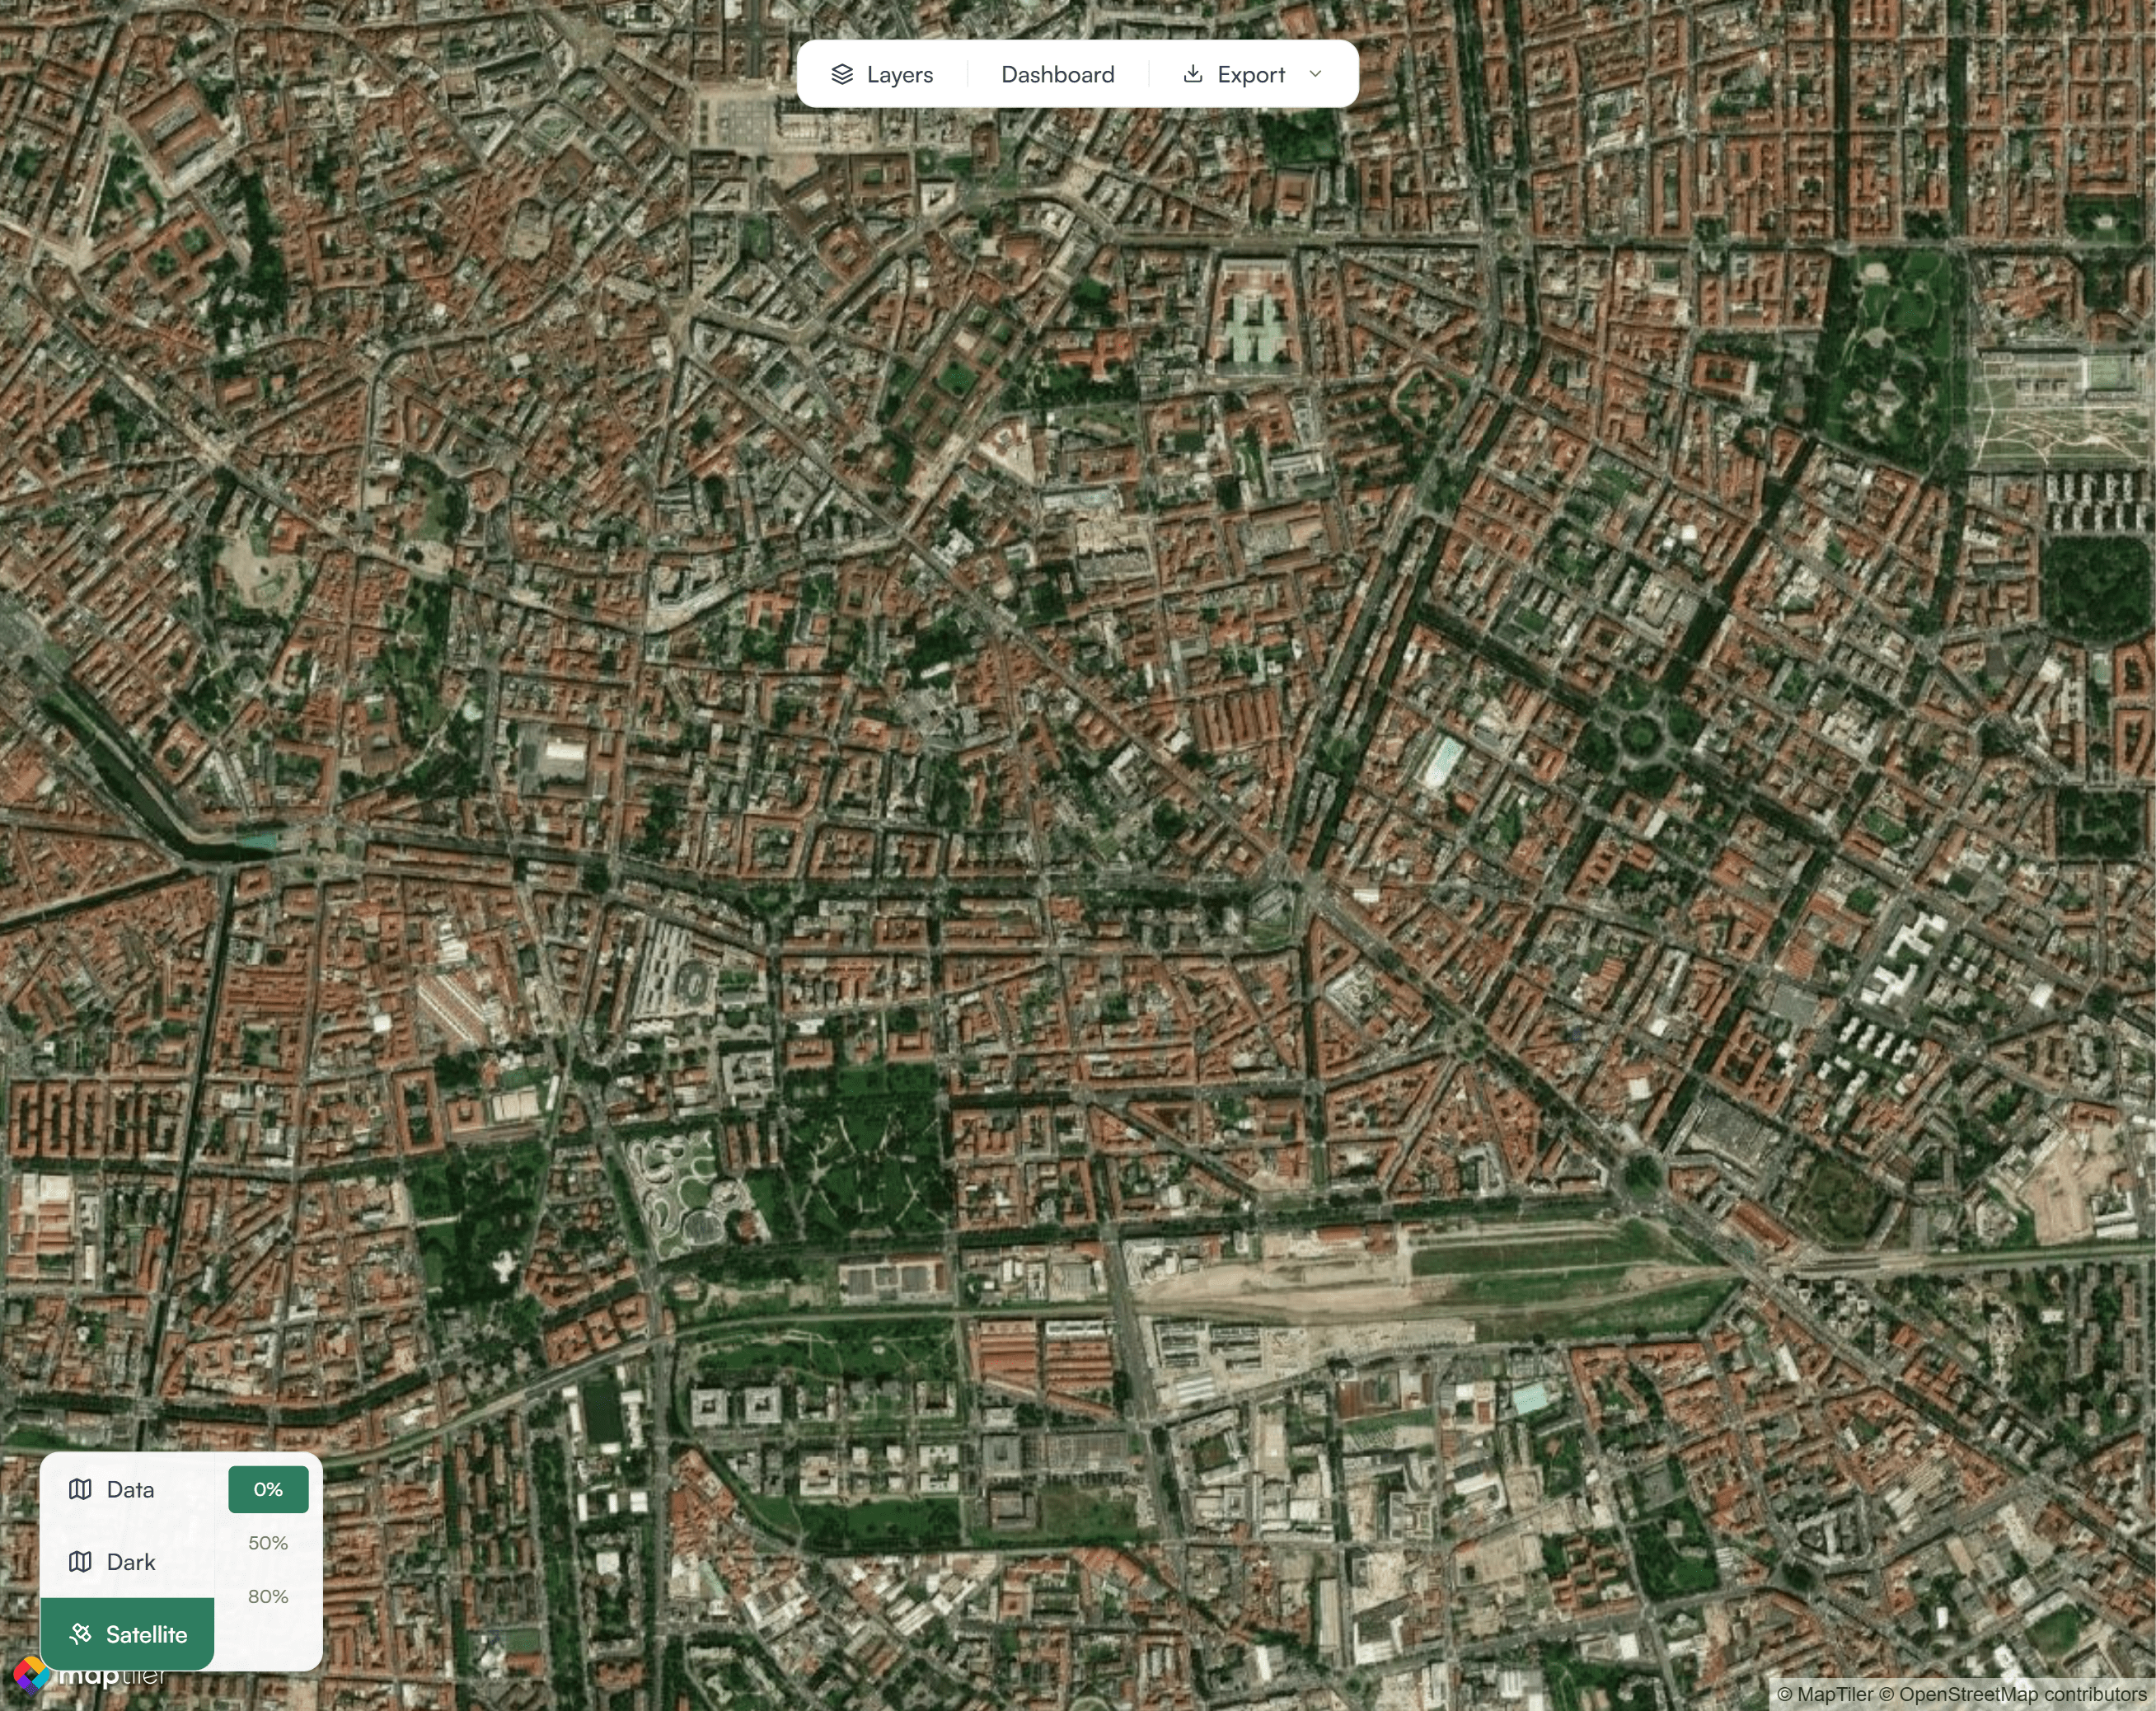
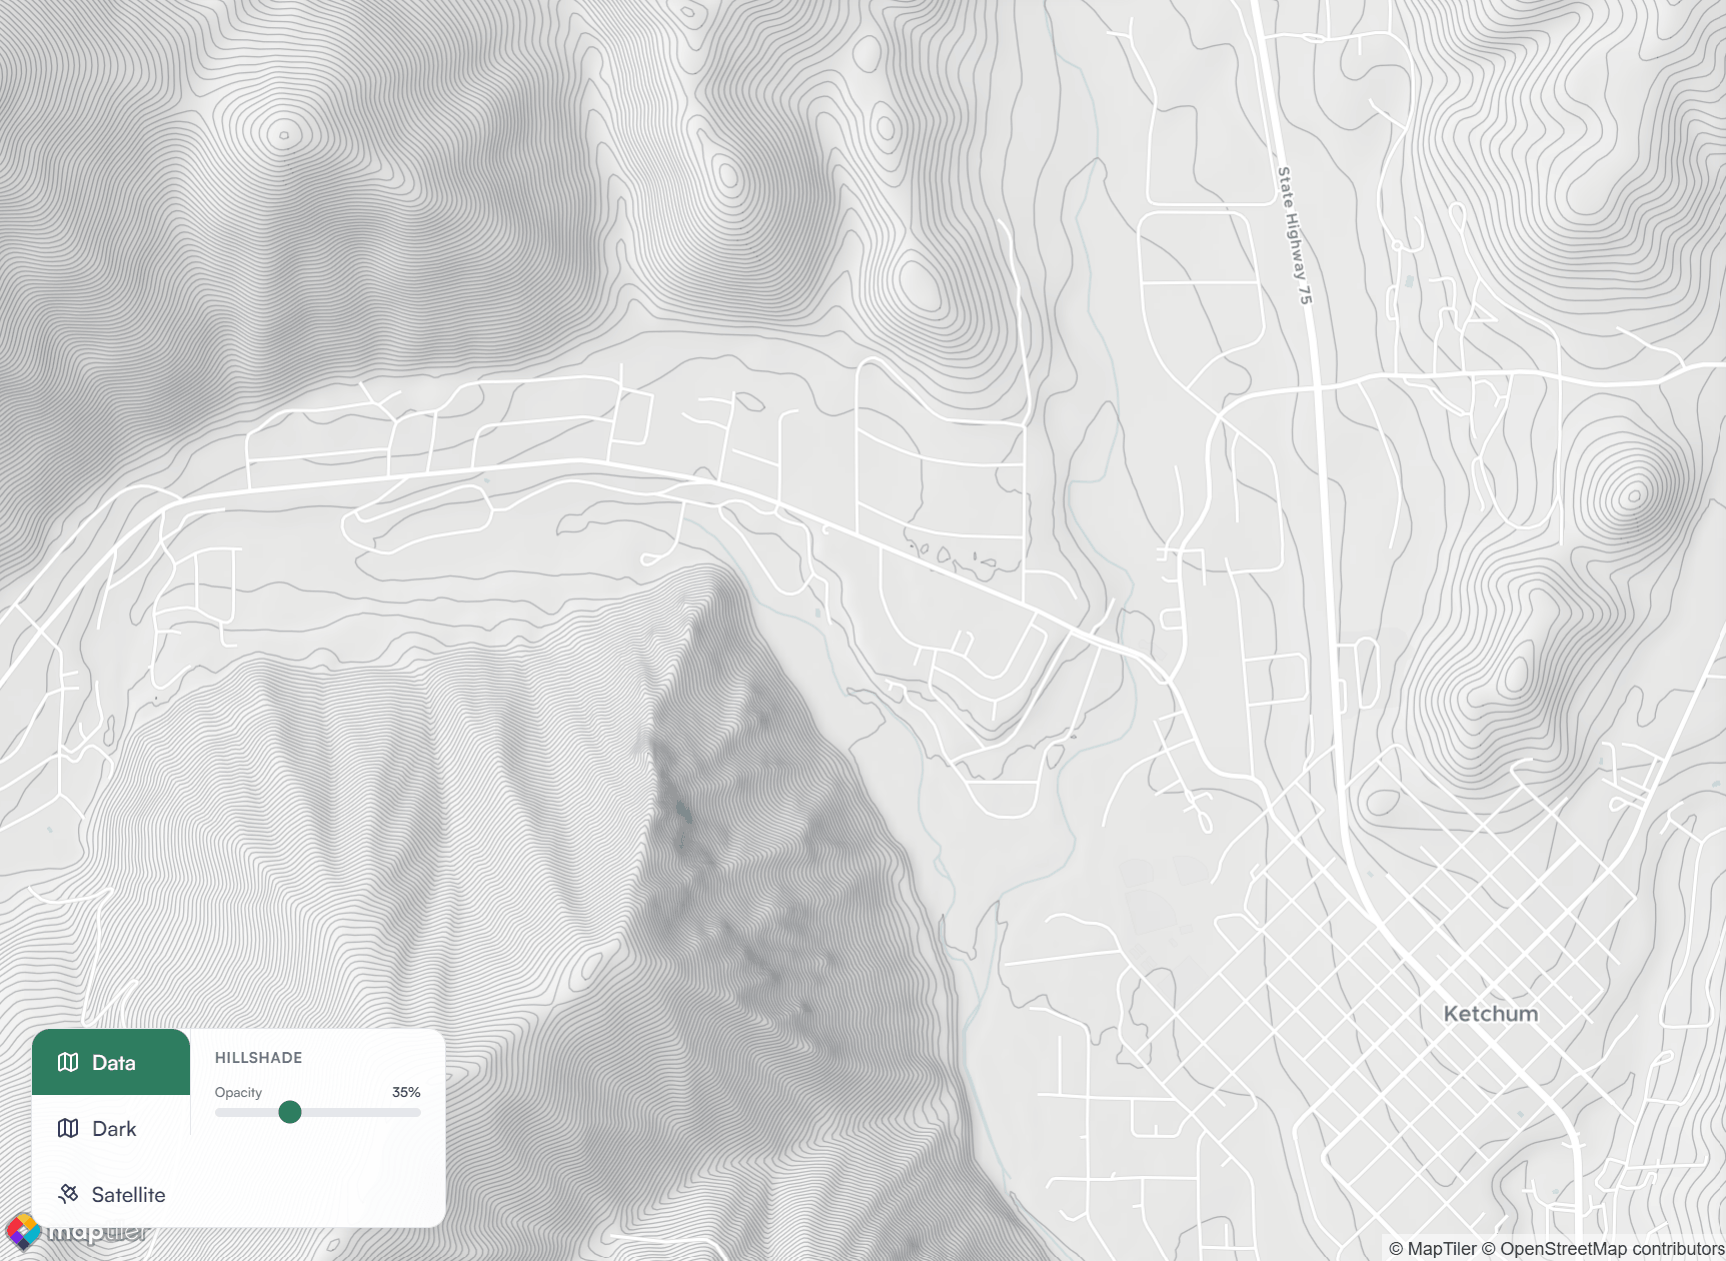
Satellite Imagery
Multi-spectral imagery from leading space agencies, composited and cloud-filtered to derive surface temperature, vegetation, and land-cover indicators.
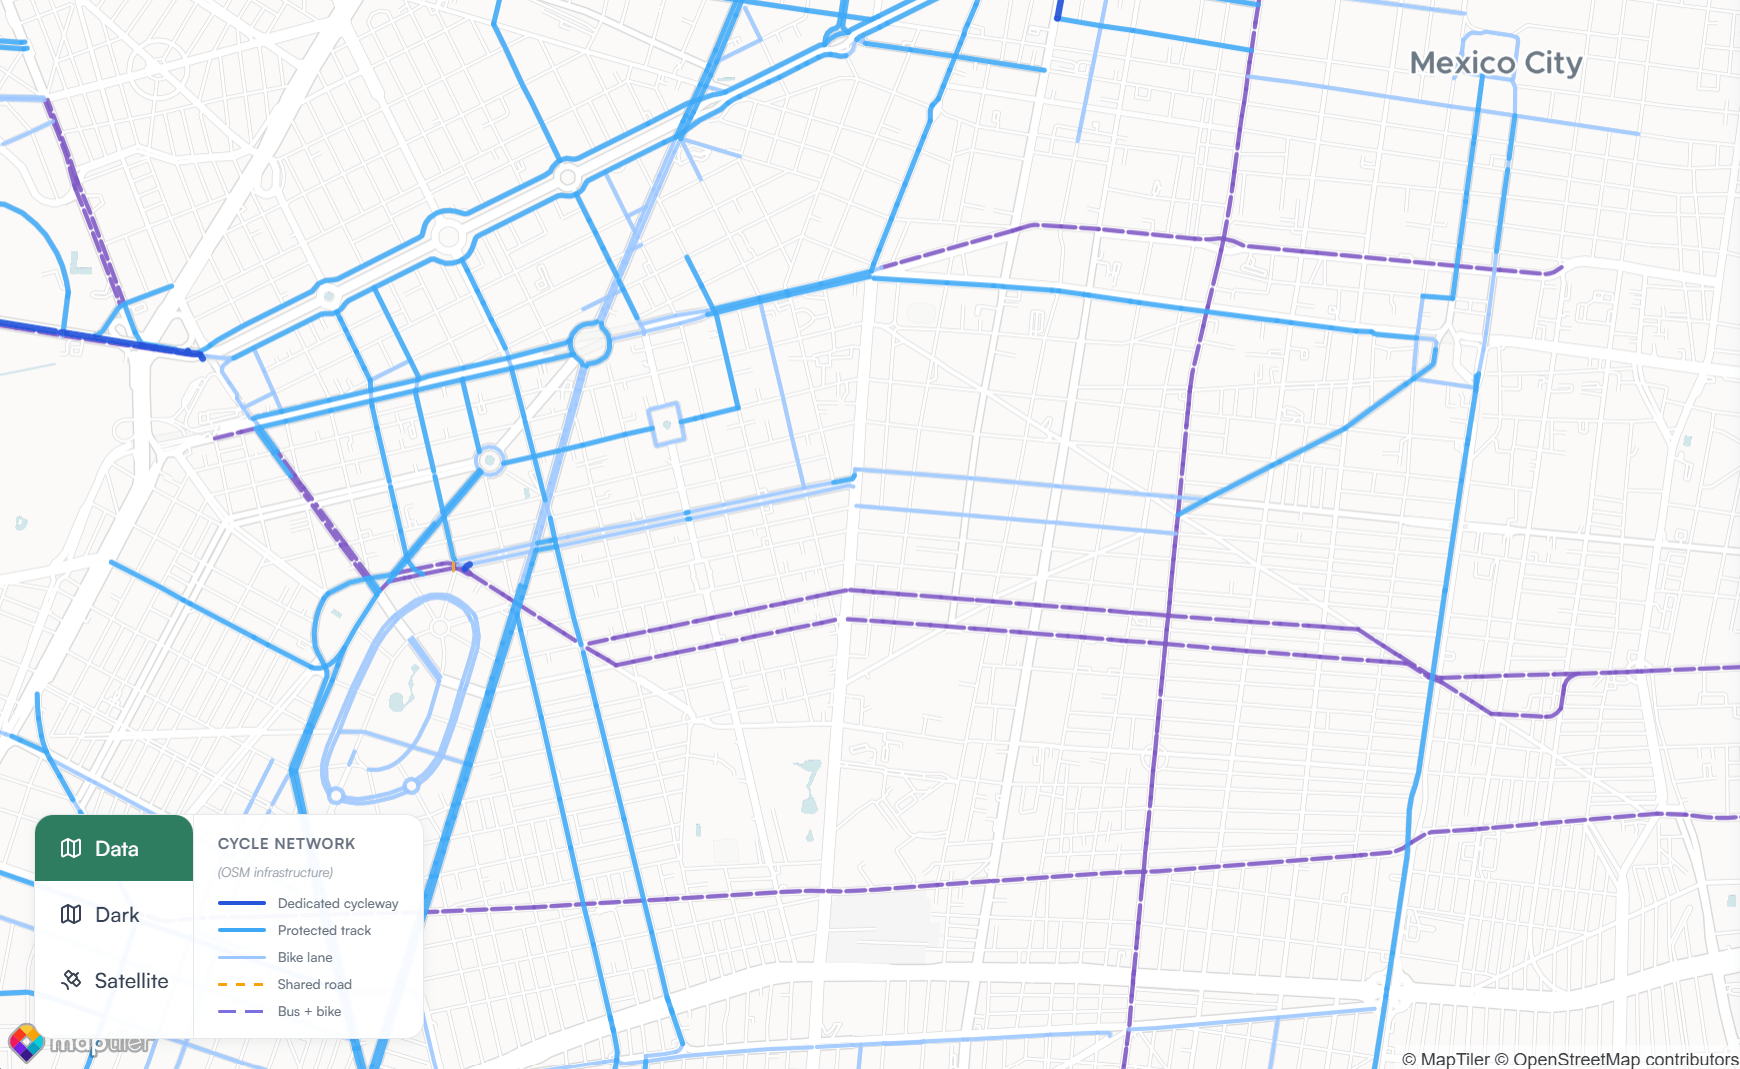
Global Maps & Infrastructure
Street networks, building footprints, and key amenities from collaborative mapping initiatives and global geodata foundations.
Population & Demographics
High-resolution population grids and demographic indicators from national statistics offices, research institutions, and NGO projects.
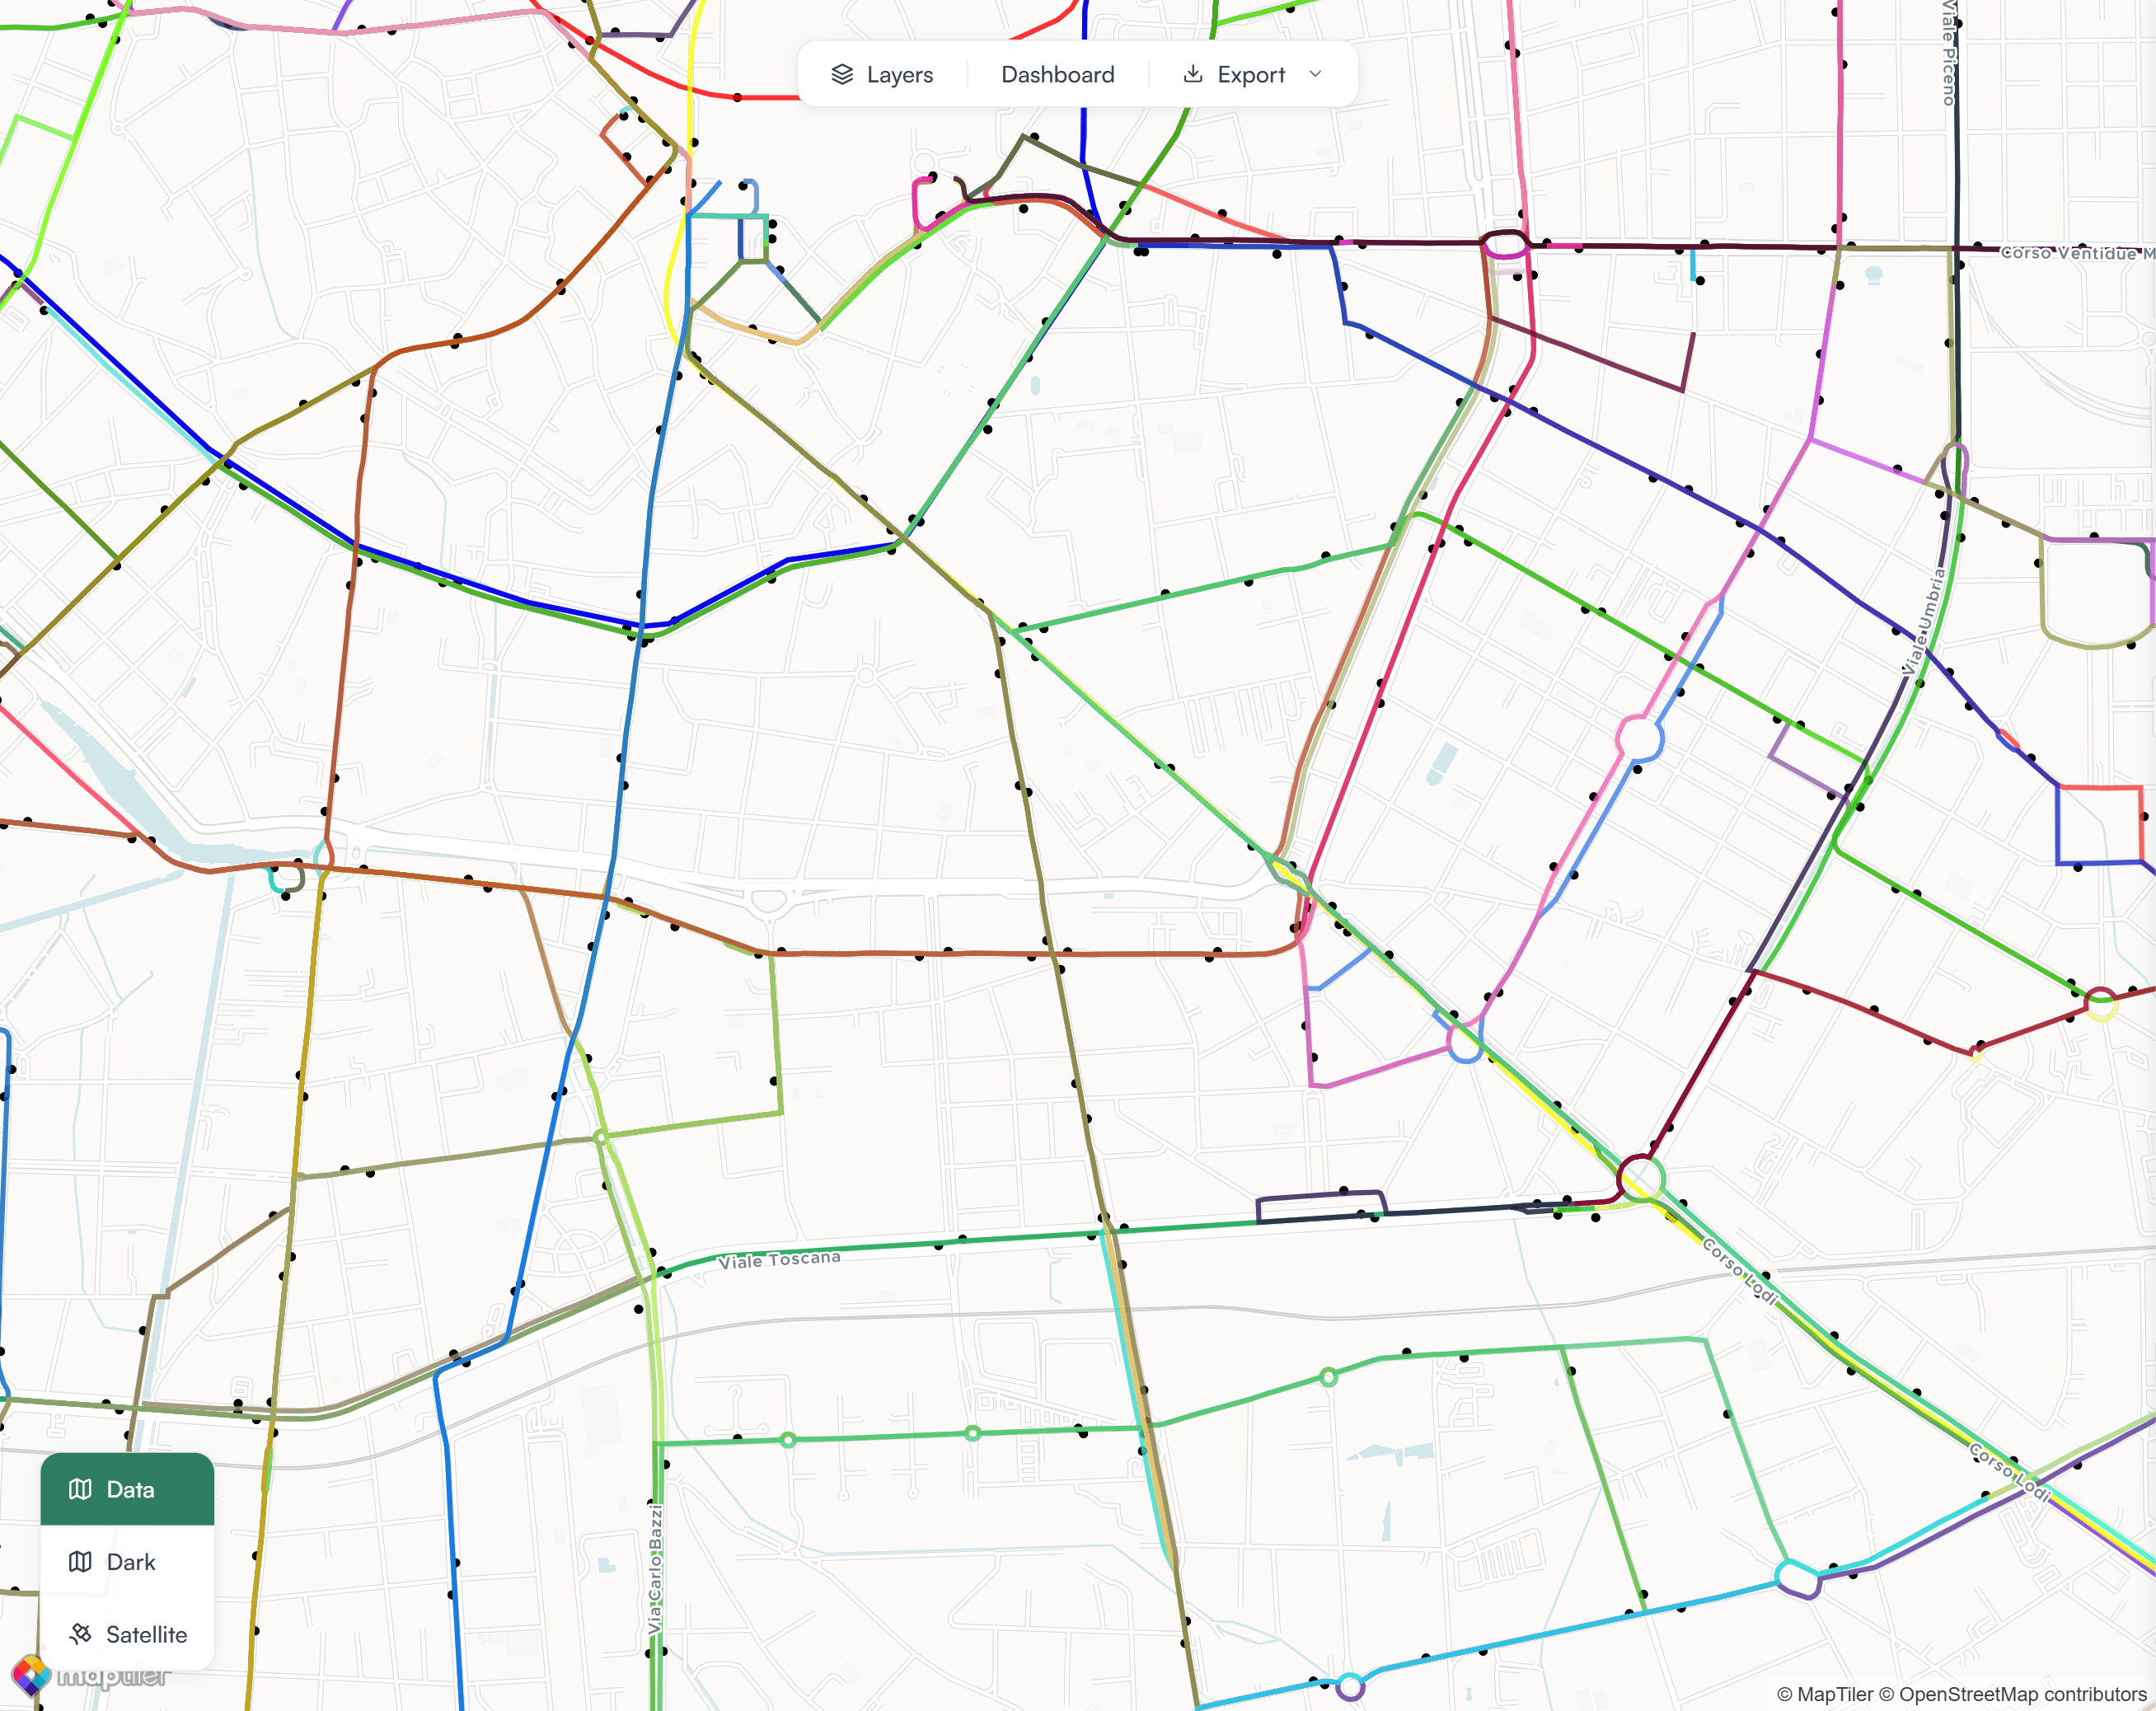
Mobility & Transit Data
Routes, stops, and frequency information from official transport agencies and verified GTFS feeds.

Satellite imagery provided by NASA and ESA satellites. Pictured: ESA’s Sentinel-2.
Simple pricing for planning professionals
No contracts, no procurement delays, perfect for freelancers and small firms.
Professional
For teams and consultancies
Starter
Ideal for independent planners and small firms working on multiple client projects.
Need help choosing a plan?
All plans include access to Maporra's urban data layers and regular updates. Prices are in USD.
For media inquiries - please contact us at


Let’s make our cities better
Maporra turns complex urban data into simple, actionable insights.